Achieving Product-Market Fit
Launch successfully and achieve sustainable product-market fit. Master brand positioning, customer acquisition, and scaling strategies.
What is Product-Market Fit?
The EXECUTE phase is about achieving and scaling Product-Market Fit (PMF) - the moment when your product satisfies a strong market demand. Marc Andreessen describes PMF as "being in a good market with a product that can satisfy that market."
Signs You've Achieved PMF
- 1.Organic Growth: Customers are finding you without paid acquisition—word-of-mouth is driving growth.
- 2.Customer Retention: Users stick around, come back frequently, and would be "very disappointed" if your product disappeared (Sean Ellis 40% Rule).
- 3.Strong Unit Economics: Your LTV:CAC ratio is healthy (>3:1), and payback periods are reasonable (<12 months for most SaaS).
- 4.Market Pull: You're struggling to keep up with demand rather than pushing to generate interest.
⚠️ Critical Warning:
Do NOT scale before achieving PMF. Premature scaling—hiring aggressively, spending heavily on marketing, expanding geographically—is the #1 killer of startups. If you don't have PMF, scaling will just amplify what's broken. First, nail the product. Then, scale.
Product-Market Fit Metrics
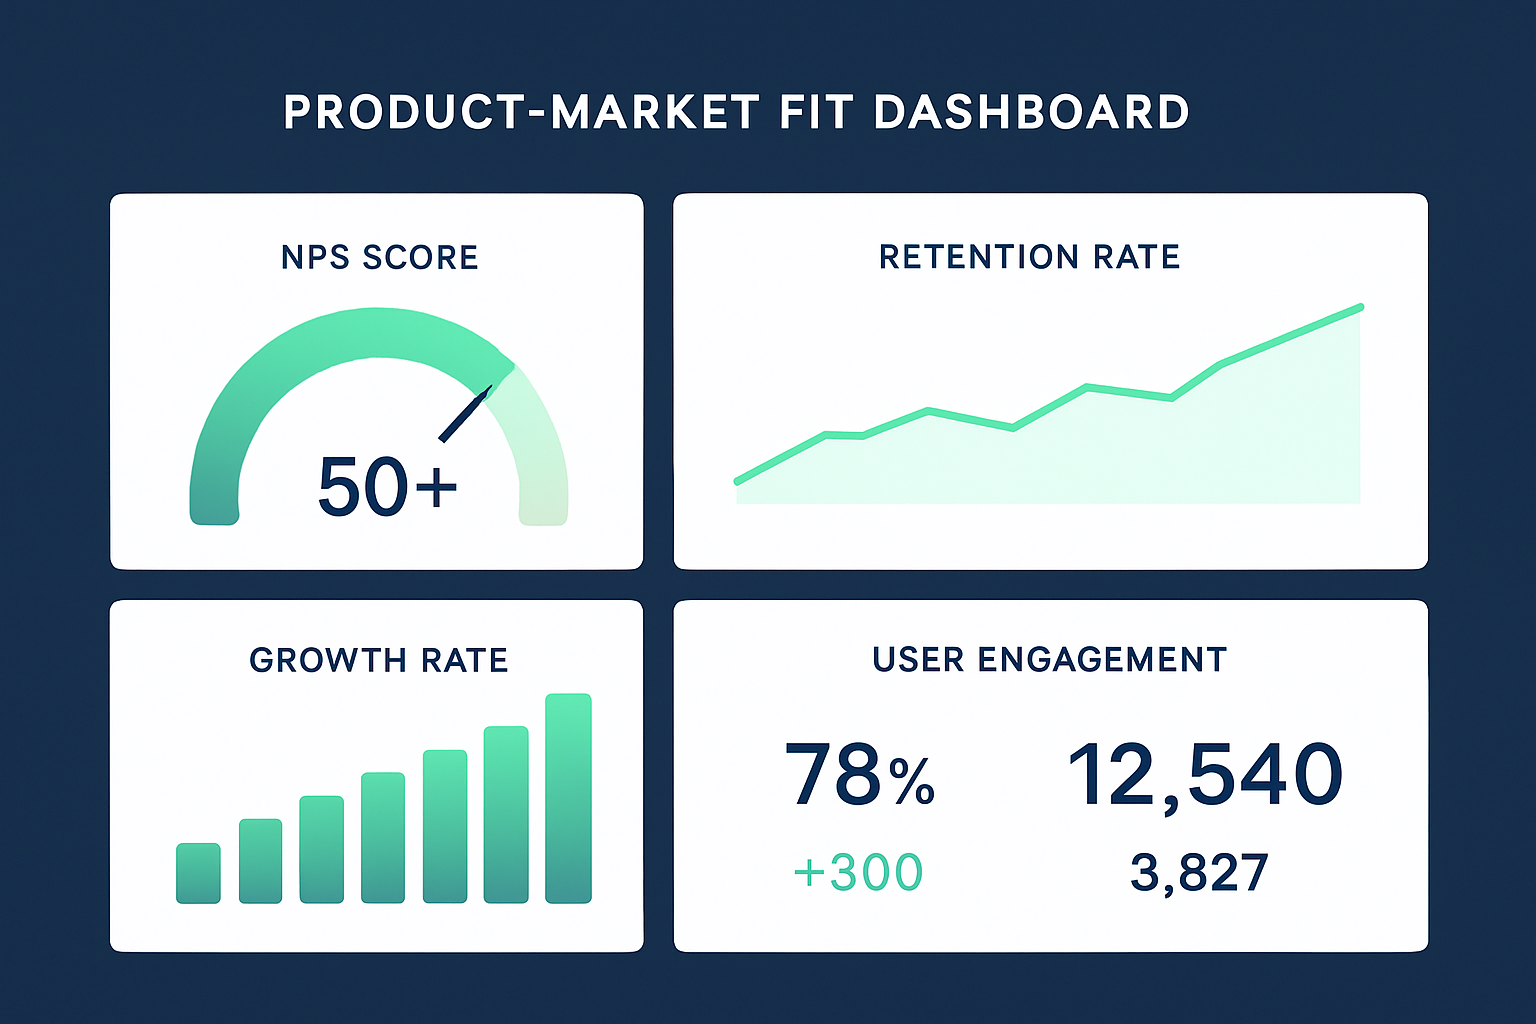
Product-Market Fit (PMF) is the holy grail of startups. Marc Andreessen defines it as "being in a good market with a product that can satisfy that market."But how do you measure it?
Key Product-Market Fit Metrics
The Sean Ellis PMF Test
Ask your users: "How would you feel if you could no longer use this product?"
Understanding Product-Market Fit
Product-Market Fit is often described as "knowing when you have it" - but this vague definition causes many founders to chase false signals. Let's break down what PMF really means and how to measure it systematically.
The Three Levels of Product-Market Fit
Level 1: Nascent PMF (First Traction)
You've found some customers who love your product. They're using it regularly, telling friends, and would be disappointed if it disappeared. But the numbers are still small - maybe 10-50 passionate users.
Level 2: Strong PMF (Repeatable Growth)
You've proven you can acquire customers efficiently and retain them. Growth is steady, retention curves are flattening (not trending to zero), and customers are telling others. You might have 100-1000 active users who genuinely depend on your product.
Level 3: Extreme PMF (Market Pull)
The market is pulling your product out of you. You can't keep up with demand. Customers are begging for your product, competitors are emerging, and growth is constrained only by your ability to scale operations. This is rare but unmistakable.
Quantitative PMF Indicators
Retention Curves
The most reliable PMF signal. Plot cohort retention over time. Healthy retention curves flatten after initial drop-off (forming a "smile"), indicating you've found sticky value. If curves trend toward zero, you don't have PMF yet.
Sean Ellis Score
Survey users: "How would you feel if you could no longer use this product?" 40%+ answering "very disappointed" strongly correlates with successful growth.
Net Promoter Score (NPS)
Ask: "On a scale of 0-10, how likely are you to recommend us?" NPS = % promoters (9-10) minus % detractors (0-6). Target: NPS >30 for PMF.
Growth Accounting
Track: New Users + Reactivated Users - Churned Users. If churned users exceed new users, you're in a "leaky bucket" situation - fix retention before scaling acquisition.
Qualitative PMF Signals
Organic Word-of-Mouth
Are users telling friends without prompting? Check referral sources, social mentions, and direct feedback. Superhuman grew to $20M ARR almost entirely through word-of-mouth before launching publicly.
Customer Resistance to Churn
When you remove features or raise prices, do customers complain vocally? Strong reactions indicate dependency. Slack users famously revolt when the platform goes down - a sign of true PMF.
Growing Without Marketing
Are you acquiring customers even when you pause marketing efforts? Organic growth indicates product pull. Dropbox grew from 100K to 4M users in 15 months primarily through referrals.
User Desperation in Feedback
Do users beg for features or express how painful their life was before your product? Emotional, desperate language in feedback indicates you're solving a real, painful problem.
⚠️ False Positive Signals
Beware of metrics that look like PMF but aren't:
- • Vanity metrics - Total signups, page views, downloads without retention data
- • Paid growth without retention - You can buy users, but if they don't stick, you don't have PMF
- • Press coverage - Media attention is great for ego but doesn't equal product-market fit
- • Single hero customer - One enterprise customer paying big bucks doesn't mean you've found repeatable PMF
- • High engagement without growth - 10 passionate users aren't PMF; you need scalable acquisition too
PMF Stories from Africa & Europe
How did founders know they had PMF in different market contexts?
🇰🇪 Jumia (Nigeria/Kenya) - E-commerce PMF in Africa
🇩🇪 N26 (Germany) - Neo-Bank PMF in Europe
🇿🇦 Takealot (South Africa) - Finding PMF through Persistence
🇬🇧 Monzo (UK) - Community-Driven PMF
Mastering Unit Economics
Unit economics determine whether your business model is fundamentally viable. Understanding these metrics is critical before you scale - otherwise, you might be accelerating toward a cliff.
The Golden Rule of Unit Economics
Your customer lifetime value (LTV) should be at least 3x your customer acquisition cost (CAC), and you should recover CAC within 12 months. This ensures you have enough margin to operate profitably and reinvest in growth.
Calculating Customer Lifetime Value (LTV)
For Subscription Businesses:
Example: $50/month ARPU, 80% margin, 5% monthly churn → LTV = $50 × 0.8 ÷ 0.05 = $800
For Transactional Businesses:
Example: $100 order, 40% margin, 4 purchases/year, 3-year lifespan → LTV = $100 × 0.4 × 4 × 3 = $480
Calculating Customer Acquisition Cost (CAC)
Full CAC Formula:
Include: salaries, software, ads, events, content creation, agencies
Blended vs. Paid CAC:
- • Blended CAC: All marketing costs ÷ all new customers (includes organic)
- • Paid CAC: Paid marketing costs ÷ paid customers only
- • Track both - blended CAC masks channel efficiency
CAC Payback Period:
Target: <12 months for most businesses, <6 months for aggressive growth
Real-World Unit Economics Examples
Netflix (Healthy)
Early Uber (Risky)
MoviePass (Broken)
Regional Unit Economics Examples:
🇳🇬 Paystack (Nigeria) - Healthy SaaS Economics
Paystack's low CAC came from developer-focused content marketing (tutorials, documentation). Acquired by Stripe for $200M.
🇸🇪 Klarna (Sweden) - Premium Unit Economics
Klarna's genius: merchants pay CAC, not Klarna. They integrate at checkout, so customer acquisition is nearly free for Klarna.
🇿🇦 TymeBank (South Africa) - Neo-Bank Economics
TymeBank's innovation: in-store kiosks at supermarkets for signups (no branches). CAC 90% lower than traditional banks. 5M+ customers in 3 years.
🇬🇧 Deliveroo (UK) - Marketplace Economics
Deliveroo improved economics by focusing on high-frequency urban areas (London, Paris) rather than spreading thin. Density = profitability in food delivery.
💡 Improving Your Unit Economics
Increase LTV by:
- • Reducing churn through better onboarding and support
- • Upselling/cross-selling to existing customers
- • Increasing prices (if value justifies it)
- • Adding complementary products/services
- • Improving product stickiness and engagement
Decrease CAC by:
- • Optimizing conversion funnels
- • Building organic/referral channels
- • Improving targeting to reduce wasted spend
- • Creating viral/network effects in product
- • Leveraging content marketing and SEO
Brand Positioning Strategy
Strong positioning differentiates you from competitors and makes your value proposition crystal clear. Use April Dunford's positioning framework to nail your market position.
Positioning Components
Competitive Alternatives
What would customers do if your solution didn't exist?
Unique Attributes
What features/capabilities do you have that alternatives don't?
Value (Benefits)
What value do those unique attributes deliver?
Target Segment
Which customers care most about that value?
Market Category
What market should customers think of you in?
Positioning Statement Template
"For [target segment] who are dissatisfied with[competitive alternatives], our product is a [market category] that provides[unique value]. Unlike [alternatives], we[unique attributes]."
Customer Acquisition Strategies
Based on Gabriel Weinberg's "Traction", there are 19 customer acquisition channels. The mistake most founders make is trying to be everywhere at once. Instead, focus deeply on 2-3 channels that work for your specific business model and customer segment.
The Bullseye Framework
Think of traction channels as a dartboard. Your goal is to find the "bullseye" - the one channel that can drive most of your growth. Test broadly in the outer ring, narrow down in the middle ring, and focus everything on what works in the center.
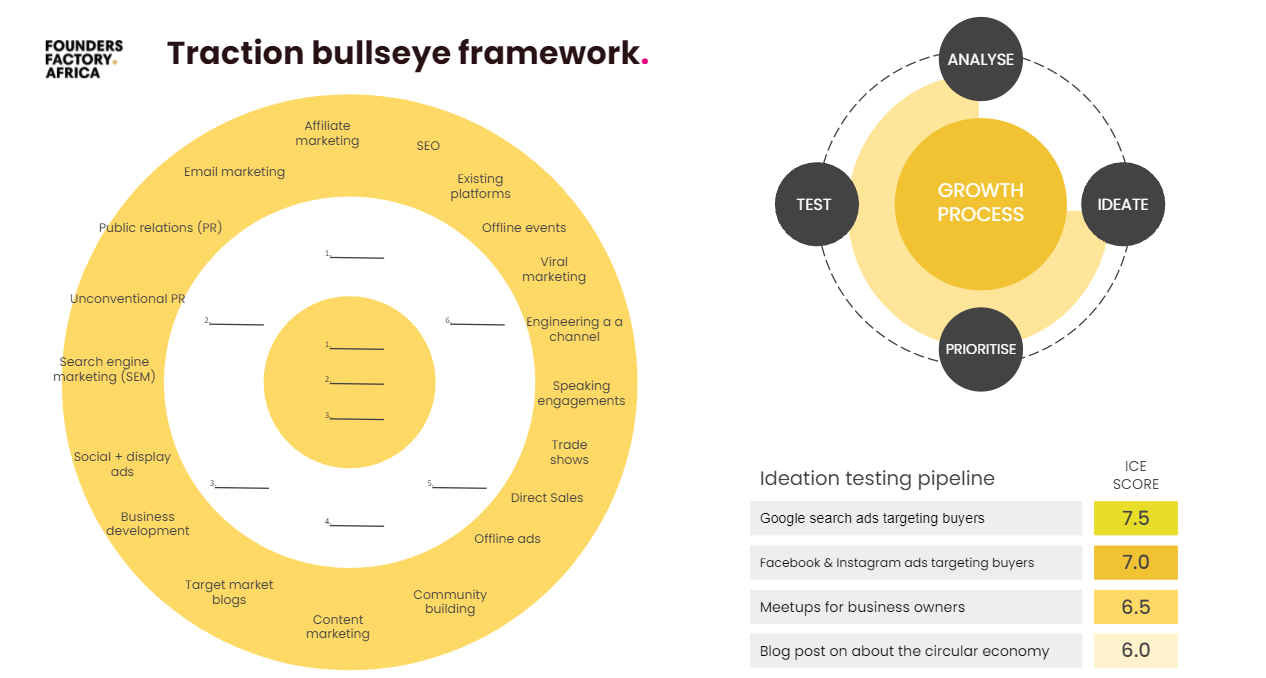
The 19 Traction Channels
1. Viral Marketing
Build virality into product (referrals, sharing)
Best for: Consumer apps, social products (Dropbox, Hotmail)
2. Public Relations (PR)
Media coverage in publications, podcasts, TV
Best for: Novel products, founder stories (Airbnb, Tesla)
3. Unconventional PR
Stunts, guerrilla marketing, controversy
Best for: Breaking through noise (Dollar Shave Club video)
4. Search Engine Marketing (SEM)
Google Ads, Bing Ads, paid search
Best for: High LTV businesses, B2B SaaS
5. Social & Display Ads
Facebook, Instagram, LinkedIn, TikTok ads
Best for: Visual products, B2C, mobile apps
6. Offline Ads
TV, radio, billboards, print
Best for: Mass market, local businesses
7. Search Engine Optimization (SEO)
Organic search rankings
Best for: Content-driven products (HubSpot, Canva)
8. Content Marketing
Blog posts, videos, podcasts, guides
Best for: Educational products, B2B (Moz, Buffer)
9. Email Marketing
Newsletters, drip campaigns, lifecycle emails
Best for: Nurturing leads, re-engagement
10. Engineering as Marketing
Free tools, calculators, widgets
Best for: SaaS, technical products (HubSpot's free CRM)
11. Targeting Blogs
Guest posts, blog sponsorships
Best for: Niche audiences, B2B
12. Business Development (BD)
Strategic partnerships, co-marketing
Best for: B2B, platforms (Spotify + Facebook)
13. Sales
Direct sales, inside sales, field sales
Best for: Enterprise B2B, high-touch products
14. Affiliate Programs
Pay partners for referrals
Best for: E-commerce, SaaS (Amazon Associates)
15. Existing Platforms
App stores, marketplaces (iOS, Shopify)
Best for: Apps, plugins, extensions
16. Trade Shows
Industry conferences and events
Best for: B2B, physical products
17. Offline Events
Meetups, workshops, pop-ups
Best for: Local businesses, community products
18. Speaking Engagements
Conferences, podcasts, webinars
Best for: Thought leadership, B2B
19. Community Building
Forums, Slack/Discord, user groups
Best for: Developer tools, niche products (Notion)
Channel Testing Framework
1. Brainstorm & Prioritize
- • List all 19 channels
- • Rank by cost, time, and likelihood of success
- • Consider where your customers already spend time
- • Choose top 5 to test
2. Run Cheap Tests
- • Design experiments (1-2 weeks each)
- • Set budget limits ($500-$1000 per test)
- • Track CAC, quality, and conversion rate
- • Measure customer retention by channel
3. Scale What Works
- • Identify 1-2 channels with best unit economics
- • Increase budget 10x on winners
- • Hire specialists for those channels
- • Optimize relentlessly
Real Example: Airbnb's Craigslist Hack (USA)
In 2010, Airbnb discovered they could post their listings to Craigslist (Channel #15: Existing Platforms). They built a bot that cross-posted to Craigslist, driving massive traffic at zero cost. This single channel helped them reach millions of users before they had any other traction channels working.
Lesson: Look for underutilized platforms where your target customers already congregate.
🇿🇦 Yoco's Channel Testing Journey (South Africa)
Yoco (card payment devices for small businesses) tested all 19 channels. They found their bullseye was direct sales + community building. They hired field reps to visit markets, salons, and cafes in person (Channel #13: Sales + #19: Community). This seemed "unscalable" but converted 40% of demos into customers.
🇪🇪 TransferWise/Wise's Referral Engine (Estonia → UK)
Wise (formerly TransferWise) initially tested PR, content marketing, and SEM. Their bullseye turned out to be viral referrals (Channel #1). They offered £50 for every 3 successful referrals - but only credited it after friends transferred £200+, ensuring quality users.
🇰🇪 Sendy's Logistics Channel Mix (Kenya)
Sendy (on-demand delivery) found that Business Development partnerships (Channel #12) was their bullseye. They partnered with e-commerce platforms (Jumia, Kilimall) to become their default last-mile delivery provider, rather than acquiring individual consumers.
Channel-Market Fit Patterns
Certain channels work better for specific business models:
Scaling Your Startup
Scaling is different from growth. Growth means adding resources (people, money, technology) at the same rate as revenue. Scaling means revenue grows faster than costs. This requires systems, processes, and leverage.
The Scaling S-Curve
Every startup goes through predictable stages. Understanding where you are helps you make the right decisions about hiring, fundraising, and strategy.
Key Scaling Challenges & Solutions
1. Hiring at Scale
Challenge: Maintaining culture and quality while hiring quickly
- • Define your culture values explicitly (write them down)
- • Create a repeatable interview process with scorecards
- • Make every employee a recruiter (referral bonuses)
- • Hire for slope (trajectory), not just Y-intercept (current skills)
- • Invest in onboarding - first 90 days are critical
2. Maintaining Product Velocity
Challenge: Shipping slows as team and codebase grow
- • Keep teams small (Amazon's "two-pizza teams")
- • Invest in dev tools, CI/CD, and testing infrastructure
- • Set up clear product roadmap and prioritization
- • Empower teams to make decisions without bottlenecks
- • Refactor and pay down technical debt regularly
3. Founder Role Transition
Challenge: Shifting from doer to manager to leader
- • Delegate tactical work; focus on strategy and culture
- • Hire executives who are better than you in their domain
- • Learn to manage through others, not just do
- • Get executive coaching (most successful founders have coaches)
- • Build your leadership team early (VP of Eng, Sales, etc.)
4. Process vs. Speed
Challenge: Balancing structure with startup agility
- • Add process only when pain becomes acute
- • Start with lightweight processes (weekly standups, sprint planning)
- • Document processes as you create them
- • Regularly audit and remove unnecessary processes
- • Use tools that scale (project management, communication)
5. Customer Success at Scale
Challenge: Maintaining high-touch service as customers grow
- • Invest in self-service resources (docs, videos, chatbots)
- • Segment customers by value (white-glove vs. self-serve)
- • Build community for peer-to-peer support
- • Use customer success tools (health scores, triggers)
- • Track and optimize onboarding conversion funnels
6. Communication Breakdown
Challenge: Information doesn't flow as org grows
- • Over-communicate company strategy and metrics
- • Hold regular all-hands meetings (weekly or monthly)
- • Use async communication tools (Slack, Notion, Loom)
- • Create clear reporting structure and decision rights
- • Make information accessible and transparent
📚 Recommended Reading on Scaling
- • "Blitzscaling" by Reid Hoffman: How to grow at lightning speed
- • "High Output Management" by Andy Grove: Management fundamentals
- • "The Messy Middle" by Scott Belsky: Navigating the hardest parts
- • "Scaling Up" by Verne Harnish: Systems and processes
- • "Who" by Geoff Smart: Hiring the right people
- • "Amp It Up" by Frank Slootman: Raising intensity and standards
📝 Finalize Your Business Model Canvas
Congratulations! You're in the EXECUTE phase. Now it's time to FINALIZE your Business Model Canvas with real operational data, proven channels, and scaling strategies—transforming it from a validation tool into your operational blueprint.
Building Blocks to Finalize After EXECUTE:
- 1.Channels: Document your proven customer acquisition channels. What channels are delivering the best CAC and LTV? Focus on what's working at scale.
- 2.Key Partnerships: As you scale, which strategic partnerships have become critical? Update with real partnerships—suppliers, distributors, technology partners, etc.
- 3.Key Activities: What are the mission-critical activities required to deliver at scale? Update based on actual operations (customer support, product development, marketing campaigns).
- 4.Key Resources: What resources do you now have? Funding raised? Team hired? Technology infrastructure? Update with real assets that enable scaling.
- 5.Cost Structure: What are your real unit economics? CAC, LTV, gross margins, burn rate? Update with actual financial data from operations.
- 6.Revenue Streams: Finalize your revenue model with proven pricing, confirmed ARPU (Average Revenue Per User), and validated monetization strategies.
🎯 Your BMC is Now Your Operating Plan:
This is version 4.0 (or higher) of your canvas—evolved from hypothesis through validation to execution. It's no longer just a planning tool; it's your operational blueprint that guides hiring, budgeting, partnerships, and growth strategies. Share it with your team, investors, and advisors.
Test Your Knowledge
EXECUTE Phase Quiz
What is the Sean Ellis Test for Product-Market Fit?
Your Progress
Go-to-Market Launch Strategy
A comprehensive framework for planning and executing your product launch, from pre-launch buzz to post-launch optimization.
Worksheet Preview:
Pre-Launch Preparation (4-6 weeks before)
- □Define your launch objectives and success metrics
- □Identify your target audience and early adopters
- □Create compelling messaging and positioning
- ... and 4 more items
Launch Campaign Execution
- □Announce to your existing network first
- □Reach out to journalists and bloggers
- □Post on relevant social media channels
- ... and 4 more items
... and 3 more sections
Video Resources

Product-Market Fit Explained
How to measure and validate product-market fit with real metrics

Traction: 19 Ways to Build a Customer Base
Gabriel Weinberg explains the Bullseye Framework for customer acquisition
🎯 Key Takeaways
- Product-market fit means customers are pulling your product from you—not you pushing it to them
- Focus on sustainable unit economics—ensure LTV is at least 3x your CAC and payback period is under 12 months
- Use the Bullseye Framework to systematically test and scale the most effective traction channels
- Complete your BMC by refining Key Activities, Key Resources, Key Partnerships, and Cost Structure for scale
- Avoid premature scaling—only scale once you have clear PMF signals and proven unit economics
📋 What's Next?
Congratulations on completing the core 3-phase framework! Continue to the Supplementary modulesto deepen your knowledge on team building, financial modeling, marketing channels, and common mistakes to avoid. Your complete BMC is now your roadmap for sustainable startup success!